2 Training Machine Learning Algorithms for Classification
- 建立机器学习算法的基础知识
- 利用pandas、NumPy和matplotlib来读入、处理和展示数据
- 用Python实现线性分类算法
Artificial neurons – a brief glimpse into the early history of machine learning
早期大脑神经元结构对人工智能研究的影响: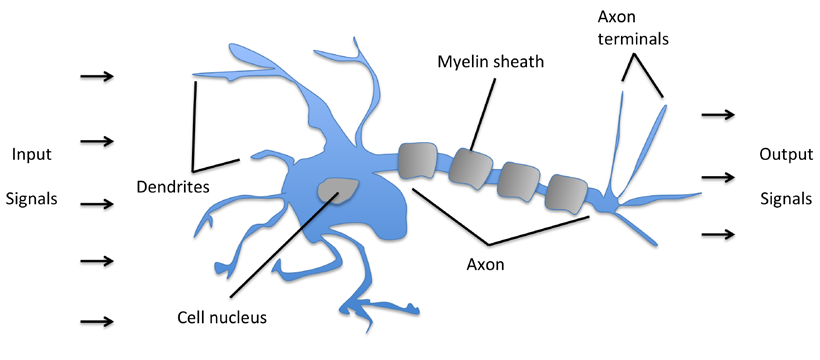
每个神经元就是一个二元分类器,定义一个激活函数Φ(z)来实现分类,其中z是一系列输入变量x的线性组合z = w1x1+w2x2+…+wmxm,其中w表示每个变量的权重:
下图描绘了输入是如何转换成二元输出的示意图: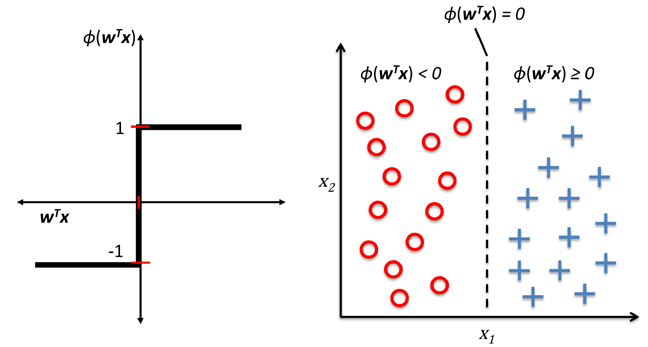
整个感知器的训练过程如下:
- 所有w初始化为0或者一个很小的随机数
- 对于每个训练样本x,计算输出y,并基于结果与否更新w,更新的变化值如下:

只有当分类结果是线性且学习率充分小时,感知器才能够保证收敛。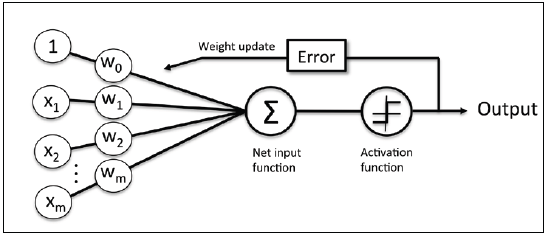
感知器概念图,在学习阶段,激活函数的输出用来更新每个输入变量的权重参数。
Implementing a perceptron learning algorithm in Python
Perceptron.py1
2
3
4
5
6
7
8
9
10
11
12
13
14
15
16
17
18
19
20
21
22
23
24
25
26
27
28
29
30
31
32
33
34
35
36
37
38
39
40
41
42
43
44
45
46
47
48
49
50
51
52
53
54
55
56
57import numpy as np
class Perceptron(object):
"""Perceptron classifier.
Parameters
----------
eta : float
Learning rate (between 0.0 and 1.0)
n_iter : int
Passes over the traning dataset.
Attributes
----------
w_ : 1d-array
Weights after fitting.
errors_ : list
Number of misclassifications in every epoch.
"""
def __init__(self, eta=0.01, n_iter=10):
self.eta = eta
self.n_iter = n_iter
def fit(self, X, y):
"""Fit training data.
Parameters
----------
X : {array-like}, shape = [n_samples, n_features]
Training vectors, where n_samples is the number of samples
and n_features is the number of features.
y : array-like, shape = [n_samples]
Target values.
Returns
-------
self : object
"""
self.w_ = np.zeros(1 + X.shape[1])
self.errors_ = []
for _ in range(self.n_iter):
errors = 0
for xi, target in zip(X, y):
update = self.eta * (target - self.predict(xi))
self.w_[1:] += update * xi
self.w_[0] += update
errors += int(update != 0.0)
self.errors_.append(errors)
return self
def net_input(self, X):
"""Calculate net input"""
return np.dot(X, self.w_[1:]) + self.w_[0]
def predict(self, X):
"""Return class label after unit step"""
return np.where(self.net_input(X) >= 0.0, 1, -1)
Training a perceptron model on the Iris dataset
为测试感知器,我们使用Iris中的Setosa和Versicolor两类数据,便于展示这里仅使用sepal length和petal length两个变量。1
2
3
4from perceptron import Perceptron
import pandas as pd
df = pd.read_csv('iris.data', header=None)
df.head()
Output:1
2
3
4
5
6 0 1 2 3 4
0 5.1 3.5 1.4 0.2 Iris-setosa
1 4.9 3.0 1.4 0.2 Iris-setosa
2 4.7 3.2 1.3 0.2 Iris-setosa
3 4.6 3.1 1.5 0.2 Iris-setosa
4 5.0 3.6 1.4 0.2 Iris-setosa
1 | %pylab inline |
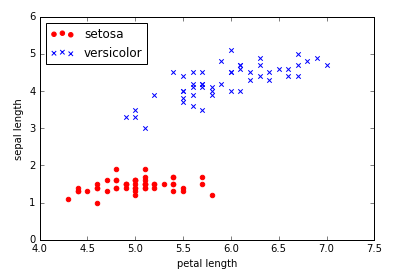
现在可以用我们的感知器来训练Iris数据1
2
3
4
5
6ppn = Perceptron(eta=0.1, n_iter=10)
ppn.fit(X, y)
plt.plot(range(1, len(ppn.errors_) + 1), ppn.errors_, marker='o')
plt.xlabel('Epochs')
plt.ylabel('Number of misclassifications')
plt.show()
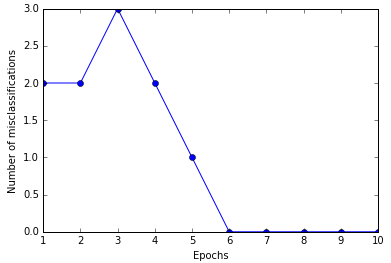
六次迭代后感知器已经收敛。
为了便于展现编写了一个2维数据可视化函数plot_decision_regions。1
2
3
4
5
6
7
8
9
10
11
12
13
14
15
16
17
18
19
20
21
22
23from matplotlib.colors import ListedColormap
def plot_decision_regions(X, y, classifier, resolution=0.02):
# setup marker generator and color map
markers = ('s', 'x', 'o', '^', 'v')
colors = ('red', 'blue', 'lightgreen', 'gray', 'cyan')
cmap = ListedColormap(colors[:len(np.unique(y))])
# plot the decision surface
x1_min, x1_max = X[:, 0].min() - 1, X[:, 0].max() + 1
x2_min, x2_max = X[:, 1].min() - 1, X[:, 1].max() + 1
xx1, xx2 = np.meshgrid(np.arange(x1_min, x1_max, resolution), np.arange(x2_min, x2_max, resolution))
Z = classifier.predict(np.array([xx1.ravel(), xx2.ravel()]).T)
Z = Z.reshape(xx1.shape)
plt.contourf(xx1, xx2, Z, alpha=0.4, cmap=cmap)
plt.xlim(xx1.min(), xx1.max())
plt.ylim(xx2.min(), xx2.max())
# plot class samples
for idx, cl in enumerate(np.unique(y)):
plt.scatter(x=X[y == cl, 0], y=X[y == cl, 1],
alpha=0.8, c=cmap(idx),
marker=markers[idx], label=cl)
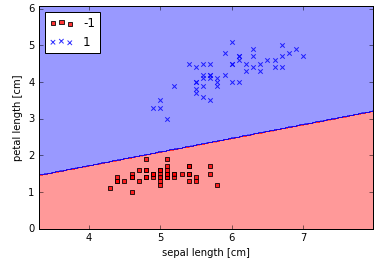
然后就可以展现感知器的分类线,能够完美区分样本中的Iris类型。1
2
3
4
5plot_decision_regions(X, y, classifier=ppn)
plt.xlabel('sepal length [cm]')
plt.ylabel('petal length [cm]')
plt.legend(loc='upper left')
plt.show()
Adaptive linear neurons and the convergence of learning
ADAptive Linear Neuron(Adaline)是对感知器算法的一个改进,其关键理念是定义并最小化成本函数,基于线性激活函数替代单步阶梯函数。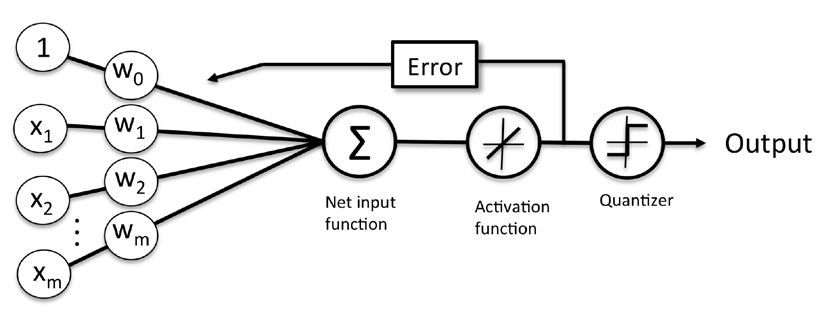
Minimizing cost functions with gradient descent
有监督学习算法的关键因素之一就是定义一个目标函数(objective function)。目标函数通常可以是最小化的陈本函数,在Adaline方法中,成本函数J定义为输出和目标的误差平方和(Sum of Squared Errors, SSE),相比单步阶梯函数该线性激活函数是可微的:
另一个优势是这是个凸函数(convex),因此可以使用一个简单强大的优化算法,梯度下降(gradient descent),找到成本函数最小的权重值。梯度下降算法示意图如下: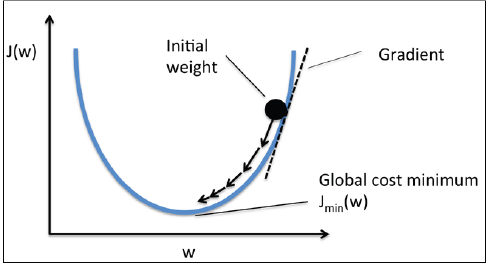
Implementing an Adaptive Linear Neuron in Python
Adaline和感知器很类似,所以可以直接在原有的代码上修改fit方法重写成本函数最小化算法。
AdalineGD.py1
2
3
4
5
6
7
8
9
10
11
12
13
14
15
16
17
18
19
20
21
22
23
24
25
26
27
28
29
30
31
32
33
34
35
36
37
38
39
40
41
42
43
44
45
46
47
48
49
50
51
52
53
54
55
56
57
58
59class AdalineGD(object):
"""ADAptive LInear NEuron classifier.
Parameters
----------
eta : float
Learning rate (between 0.0 and 1.0)
n_iter : int
Passes over the traning dataset.
Attributes
----------
w_ : 1d-array
Weights after fitting.
errors_ : list
Number of misclassifications in every epoch.
"""
def __init__(self, eta=0.01, n_iter=10):
self.eta = eta
self.n_iter = n_iter
def fit(self, X, y):
"""Fit training data.
Parameters
----------
X : {array-like}, shape = [n_samples, n_features]
Training vectors, where n_samples is the number of samples
and n_features is the number of features.
y : array-like, shape = [n_samples]
Target values.
Returns
-------
self : object
"""
self.w_ = np.zeros(1 + X.shape[1])
self.cost_ = []
for i in range(self.n_iter):
output = self.net_input(X)
errors = (y - output)
self.w_[1:] += self.eta * X.T.dot(errors)
self.w_[0] += self.eta * errors.sum()
cost = (errors**2).sum() / 2.0
self.cost_.append(cost)
return self
def net_input(self, X):
"""Calculate net input"""
return np.dot(X, self.w_[1:]) + self.w_[0]
def activation(self, X):
"""Compute linear activation"""
return self.net_input(X)
def predict(self, X):
"""Return class label after unit step"""
return np.where(self.activation(X) >= 0.0, 1, -1)
实践中,经常需要尝试不同的学习率使结果收敛。这里我们尝试0.1和0.0001两个参数进行比较。1
2
3
4
5
6
7
8
9
10
11
12
13from AdalineGD import AdalineGD
fig, ax = plt.subplots(nrows=1, ncols=2, figsize=(8, 4))
ada1 = AdalineGD(n_iter=10, eta=0.01).fit(X, y)
ax[0].plot(range(1, len(ada1.cost_) + 1), np.log10(ada1.cost_), marker='o')
ax[0].set_xlabel('Epochs')
ax[0].set_ylabel('log(Sum-squared-error)')
ax[0].set_title('Adaline - Learning rate 0.01')
ada2 = AdalineGD(n_iter=10, eta=0.0001).fit(X, y)
ax[1].plot(range(1, len(ada2.cost_) + 1), ada2.cost_, marker='o')
ax[1].set_xlabel('Epochs')
ax[1].set_ylabel('Sum-squared-error')
ax[1].set_title('Adaline - Learning rate 0.0001')
plt.show()
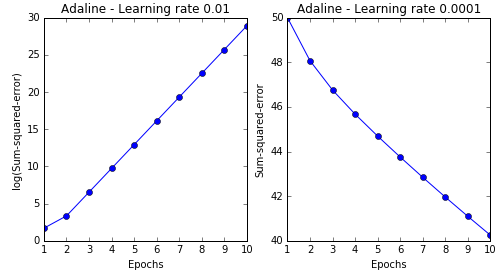
这两次实践分别遇到了两类典型的问题,第一次(左图)选用的学习率太大,算法在迭代中直接越过最小值最后发散,第二次(右图)选取的学习率太低,多次迭代后还没有达到收敛。
许多机器学习算法的调优都需要先进行特征归一化,梯度下降是其中之一。这里我们使用标准化(standardization)方法进行特征归一化,使数据分布正态化,即每个特征的以0为中心方差为1的正态分布。然后再使用0.01的学习率来训练Adaline算法。1
2
3
4
5
6
7
8
9
10
11
12
13
14
15
16X_std = np.copy(X)
X_std[:, 0] = (X[:, 0] - X[:, 0].mean()) / X[:, 0].std()
X_std[:, 1] = (X[:, 1] - X[:, 1].mean()) / X[:, 1].std()
ada = AdalineGD(n_iter=15, eta=0.01)
ada.fit(X_std, y)
plot_decision_regions(X_std, y, classifier=ada)
plt.title('Adaline - Gradient Descent')
plt.xlabel('sepal length [standardized]')
plt.ylabel('petal length [standardized]')
plt.legend(loc='upper left')
plt.show()
plt.plot(range(1, len(ada.cost_) + 1), ada.cost_, marker='o')
plt.xlabel('Epochs')
plt.ylabel('Sum-squared-error')
plt.show()
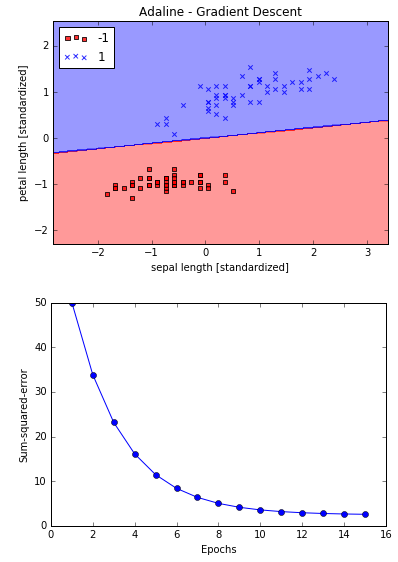
Adaline收敛,但是注意尽管所有样本都正确分类,SSE仍然不是0。
Large scale machine learning and stochastic gradient descent
现实中用梯度下降算法在百万条数据的训练非常耗时,因为每次迭代都要对全量数据进行评估并更新权重参数来达到全局最小值。一个常用的替代方案是随机梯度下降(stochastic gradient descent),权重的更新不是基于所有样本的偏差累计,而是基于每个样本的偏差,使得算法能够更频繁的更新权重参数从而快速达到收敛。为了达到准确结果,使用随机梯度下降算法每次迭代前都需要对数据进行随机排序(shuffle)。
随机梯度下降的另一个优势是可以在线学习(online learning),随着系统运行,新的训练数据不断产生,在线学习可以快速适应变化,而且若无必要保存,训练数据使用后可以直接丢弃。
我们在AdalineGD上修改fit方法的权重更新方式,新增partial_fit方法用于在线学习(不重新初始化权重),新增shuffle参数和random_state参数用于。
AdalineSGD.py1
2
3
4
5
6
7
8
9
10
11
12
13
14
15
16
17
18
19
20
21
22
23
24
25
26
27
28
29
30
31
32
33
34
35
36
37
38
39
40
41
42
43
44
45
46
47
48
49
50
51
52
53
54
55
56
57
58
59
60
61
62
63
64
65
66
67
68
69
70
71
72
73
74
75
76
77
78
79
80
81
82
83
84
85
86
87
88
89
90
91
92
93
94
95
96
97
98
99
100
101
102# coding=utf-8
import numpy as np
from numpy.random import seed
class AdalineSGD(object):
"""ADAptive LInear NEuron classifier.
Parameters
----------
eta : float
Learning rate (between 0.0 and 1.0)
n_iter : int
Passes over the traning dataset.
Attributes
----------
w_ : 1d-array
Weights after fitting.
errors_ : list
Number of misclassifications in every epoch.
shuffle : bool (default: True)
Shuffles traning data every epoch if True to prevent cycles.
random_state : int (default: None)
Set random state for shuffling and initializing the weights.
"""
def __init__(self, eta=0.01, n_iter=10, shuffle=True, random_state=None):
self.eta = eta
self.n_iter = n_iter
self.w_initialized = False
self.shuffle = shuffle
if random_state:
seed(random_state)
def fit(self, X, y):
"""Fit training data.
Parameters
----------
X : {array-like}, shape = [n_samples, n_features]
Training vectors, where n_samples is the number of samples
and n_features is the number of features.
y : array-like, shape = [n_samples]
Target values.
Returns
-------
self : object
"""
self._initialize_weights(X.shape[1])
self.cost_ = []
for i in range(self.n_iter):
if self.shuffle:
X, y = self._shuffle(X, y)
cost = []
for xi, target in zip(X, y):
cost.append(self._update_weights(xi, target))
avg_cost = sum(cost)/len(y)
self.cost_.append(avg_cost)
return self
def partial_fit(self, X, y):
"""Fit training data without reinitializing the weights"""
if not self.w_initialized:
self._initialize_weights(X.shape[1]) # ndarray.shap 返回一个维度列表, 列表长度等于维数(ndarray.ndim)
if y.ravel().shape[0] > 1:
for xi, target in zip(X, y):
self._update_weights(xi, target)
else:
self._update_weights(X, y)
return self
def _shuffle(self, X, y):
"""Shuffle training data"""
r = np.random.permutation(len(y)) # permutation若传入一个整数,返回一个洗牌后的arange
return X[r], y[r]
def _initialize_weights(self, m):
"""Initialize weights to zeros"""
self.w_ = np.zeros(1 + m)
self.w_initialized = True
def _update_weights(self, xi, target):
"""Apply Adaline learning rule to update the weights"""
output = self.net_input(xi)
error = (target - output)
self.w_[1:] += self.eta * xi.dot(error)
self.w_[0] += self.eta * error
cost = 0.5 * error**2
return cost
def net_input(self, X):
"""Calculate net input"""
return np.dot(X, self.w_[1:]) + self.w_[0]
def activation(self, X):
"""Compute linear activation"""
return self.net_input(X)
def predict(self, X):
"""Return class label after unit step"""
return np.where(self.activation(X) >= 0.0, 1, -1)
使用AdalineSGD:1
2
3
4
5
6
7
8
9
10
11
12
13
14from AdalineSGD import AdalineSGD
ada = AdalineSGD(n_iter=15, eta=0.01, random_state=1)
ada.fit(X_std, y)
plot_decision_regions(X_std, y, classifier=ada)
plt.title('Adaline - Stochastic Gradient Descent')
plt.xlabel('sepal length [standardized]')
plt.ylabel('petal length [standardized]')
plt.legend(loc='upper left')
plt.show()
plt.plot(range(1, len(ada.cost_) + 1), ada.cost_, marker='o')
plt.xlabel('Epochs')
plt.ylabel('Average Cost')
plt.show()
从结果可以看到平均成本下降非常迅速,15次迭代后效果和梯度下降差不多。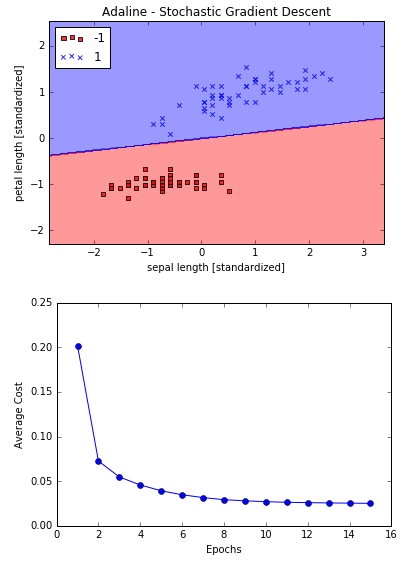
如果需要在在线环境下基于流数据进行可以调用partial_fit方法针对每条记录进行训练。用法如下:ada.partial_fit(X_std[0, :], y[0])