0 Preface
dataquest.io是一个在线学习数据科学的网站,内容涵盖Python、数据分析、数据可视化、统计学、机器学习、大数据工具、R等内容,并提供在线交互式编程环境,今天我们先来学习Kaggle的一个入门教程:Getting started with Kaggle
1 The Competition
首先我们从Kaggle上最简单的题目入手:Titanic: Machine Learning from Disaster,预测Titanic号上乘客的幸存情况,在这个教程中,我们首先浏览数据,然后训练第一个模型。
数据是.csv格式的,环境使用本地的Jupyter Notebook。首先需要下载训练和验证数据集:train.csv和test.csv,这两个文件格式相同,每一行数据代表Titanic号上的一名乘客,包含的字段如下:
PassengerId唯一的乘客号Survived表示乘客是(1)否(0)幸存,也是我们需要预测的目标值Pclass乘客所住舱位等级,分为1、2、3,1最高Name乘客的姓名Sex乘客的性别,male或femaleAge乘客的年龄,有缺失SibSp乘客在船上的兄弟或配偶数Parch乘客在船上的父母或子女数Ticket乘客的船票号码Fare乘客船票的票价Cabin乘客所住的船舱号Embarked乘客登船地点
建模前首先需要学习领域知识,思考下那些变量可能与我们需要预测的目标存在关联。了解Titanic号事件的背景知识肯定会对此有所助益。
通常来说妇女和儿童更容易幸存,因此Age和Sex是较显著的预测变量。舱位等级也可能对目标产生影响,因为头等舱更加靠近甲板,票价和舱位等级相关,因此也很有用。同伴数(包括兄弟、配偶、父母、子女)可能也会有关,因为同伴越多意味着帮助你的人越多。
其他诸如Name、Ticket、Embarked可能就与目标没有什么关联。
2 Looking At The Data
了解训练数据的概貌是一个不错的开始,这里我们使用pandas的.discribe()方法来查看下不同变量的特征和分布。1
2
3
4
5
6
7
8
9import pandas
# We can use the pandas library in python to read in the csv file.
# This creates a pandas dataframe and assigns it to the titanic variable.
titanic = pandas.read_csv("train.csv")
# Print the first 5 rows of the dataframe.
print(titanic.head(5))
print(titanic.describe())
Output:1
2
3
4
5
6
7
8
9
10
11
12
13
14
15
16
17
18
19
20
21
22
23
24
25
26
27
28
29
30
31
32
33
34
35
36
37
38
39 PassengerId Survived Pclass \
0 1 0 3
1 2 1 1
2 3 1 3
3 4 1 1
4 5 0 3
Name Sex Age SibSp \
0 Braund, Mr. Owen Harris male 22.0 1
1 Cumings, Mrs. John Bradley (Florence Briggs Th... female 38.0 1
2 Heikkinen, Miss. Laina female 26.0 0
3 Futrelle, Mrs. Jacques Heath (Lily May Peel) female 35.0 1
4 Allen, Mr. William Henry male 35.0 0
Parch Ticket Fare Cabin Embarked
0 0 A/5 21171 7.2500 NaN S
1 0 PC 17599 71.2833 C85 C
2 0 STON/O2. 3101282 7.9250 NaN S
3 0 113803 53.1000 C123 S
4 0 373450 8.0500 NaN S
PassengerId Survived Pclass Age SibSp \
count 891.000000 891.000000 891.000000 714.000000 891.000000
mean 446.000000 0.383838 2.308642 29.699118 0.523008
std 257.353842 0.486592 0.836071 14.526497 1.102743
min 1.000000 0.000000 1.000000 0.420000 0.000000
25% 223.500000 0.000000 2.000000 NaN 0.000000
50% 446.000000 0.000000 3.000000 NaN 0.000000
75% 668.500000 1.000000 3.000000 NaN 1.000000
max 891.000000 1.000000 3.000000 80.000000 8.000000
Parch Fare
count 891.000000 891.000000
mean 0.381594 32.204208
std 0.806057 49.693429
min 0.000000 0.000000
25% 0.000000 7.910400
50% 0.000000 14.454200
75% 0.000000 31.000000
max 6.000000 512.329200
3 Missing Data
从上一步中可以看到Age字段计数只有714,而其他字段都有891个,意味着该字段存在缺失。Age字段仍然有用,我们不能因为有部分记录缺失就完全抛弃它,一个比较简单的数据清洗方式是为所有缺失值赋一个固定值,比如说所有非缺失值的中位数。1
titanic["Age"] =titanic["Age"].fillna(titanic["Age"].median())
4 Non-numeric Columns
除了Age字段存在缺失以外,我们还发现通过.describe()方法显示的数据概貌信息中并没有显示所有的字段,仅显示了数值型字段。非数值型字段无法在预测模型生效,因为机器学习算法只接受数值型变量,因此要找一个将我们需要的字段转换成数值型的方法。Ticket、Cabin、Name暂时在我们抛弃的列表中。
5 Converting The Sex Column
Sex是一个我们希望保留的非数值型变量,我们可以将每一个性别类型用一个数值表示。1
2
3
4
5
6# Find all the unique genders -- the column appears to contain only male and female.
print(titanic["Sex"].unique())
# Replace all the occurences of male with the number 0.
titanic.loc[titanic["Sex"] == "male", "Sex"] = 0
titanic.loc[titanic["Sex"] == "female", "Sex"] = 1
Output:1
['male' 'female']
6 Converting The Embarked Column
我们可以使用与之前类似的方式来处理Embarked字段,出现最多的取值为S,我们可以将缺失值全赋为S。然后将S转化为0,C转化为1、Q转化为2。1
2
3
4
5
6
7# Find all the unique values for "Embarked".
print(titanic["Embarked"].unique())
titanic["Embarked"] = titanic["Embarked"].fillna('S')
titanic.loc[titanic["Embarked"] == "S", "Embarked"] = 0
titanic.loc[titanic["Embarked"] == "C", "Embarked"] = 1
titanic.loc[titanic["Embarked"] == "Q", "Embarked"] = 2
Output:1
['S' 'C' 'Q' nan]
7 On To Machine Learning!
原文这里介绍线性回归,比较简单不再展开,线性回归有两个问题:
- 如果变量和目标非线性相关,那么线性回归方法效果不好
- 线性回归无法给出每个人的幸存率,只能给出是否幸存(即01标识)
8 Cross Validation
为了避免模型的过度拟合,我们需要尽可能在不同的数据上进行训练,然后再独立的测试集上进行验证。交叉检验就是一个简单的避免过度拟合的方法,我们可以将训练集分成几个部分。
例如将数据分成3份,然后:
- 在第1、2份上训练,用第3份验证
- 在第1、3份上训练,用第2份验证
- 在第2、3份上寻良,用第1份验证
9 Making Predictions
我们使用优秀的scikit-learn包来建立预测模型,使用KFold将数据切分用于交叉检验,然后按照#8中的步骤进行建模。1
2
3
4
5
6
7
8
9
10
11
12
13
14
15
16
17
18
19
20
21
22
23
24
25# Import the linear regression class
from sklearn.linear_model import LinearRegression
# Sklearn also has a helper that makes it easy to do cross validation
from sklearn.cross_validation import KFold
# The columns we'll use to predict the target
predictors = ["Pclass", "Sex", "Age", "SibSp", "Parch", "Fare", "Embarked"]
# Initialize our algorithm class
alg = LinearRegression()
# Generate cross validation folds for the titanic dataset. It return the row indices corresponding to train and test.
# We set random_state to ensure we get the same splits every time we run this.
kf = KFold(n_splits=3, random_state=1).split(titanic)
predictions = []
for train, test in kf:
# The predictors we're using the train the algorithm. Note how we only take the rows in the train folds.
train_predictors = (titanic[predictors].iloc[train,:])
# The target we're using to train the algorithm.
train_target = titanic["Survived"].iloc[train]
# Training the algorithm using the predictors and target.
alg.fit(train_predictors, train_target)
# We can now make predictions on the test fold
test_predictions = alg.predict(titanic[predictors].iloc[test,:])
predictions.append(test_predictions)
注意这里KFold使用方法和原文中的不同,是因为在sklearn 0.18版本中sklearn.cross_validation已经更新为sklearn.model_selection,KFold的使用方法有所改变。
10 Evaludating Error
接下来就能够检验一下我们模型的预测结果,根据Kaggle竞赛的规则,衡量模型结果的指标是正确预测结果的比率,我们也使用这个指标来评估我们的模型。
预测结果字段为predictions,只要简单比较一下和titanic["Survived"]相同的量,然后再除以总人数即可。1
2
3from __future__ import division
accuracy = sum(predictions == titanic["Survived"]) / len(predictions)
print accuracy
Output:1
0.783389450056
11 Logistic regression
第一个预测模型完成了,看上去效果不是很好,准确率只有78.3%。我们可以使用逻辑回归将输出转换为0到1之间(也就是概率)。1
2
3
4
5
6
7
8
9from sklearn import model_selection
from sklearn.linear_model import LogisticRegression
# Initialize our algorithm
alg = LogisticRegression(random_state=1)
# Compute the accuracy score for all the cross validation folds. (much simpler than what we did before!)
scores = model_selection.cross_val_score(alg, titanic[predictors], titanic["Survived"], cv=3)
# Take the mean of the scores (because we have one for each fold)
print(scores.mean())
Output:1
0.787878787879
12 Processing The Test Set
现在预测的准确度有所提升,但是还不够好,在我们进一步优化前先要掌握提交我们的模型给Kaggle。
测试数据集一样需要预先清洗,注意给Age赋缺失值时需要使用训练集的中位数,另外测试集中Fare也存在缺失值,因此也要赋给一个新的值。1
2
3
4
5
6
7
8
9titanic_test = pandas.read_csv("test.csv")
titanic_test["Age"] =titanic_test["Age"].fillna(titanic["Age"].median())
titanic_test.loc[titanic_test["Sex"] == "male", "Sex"] = 0
titanic_test.loc[titanic_test["Sex"] == "female", "Sex"] = 1
titanic_test["Embarked"] = titanic_test["Embarked"].fillna('S')
titanic_test.loc[titanic_test["Embarked"] == "S", "Embarked"] = 0
titanic_test.loc[titanic_test["Embarked"] == "C", "Embarked"] = 1
titanic_test.loc[titanic_test["Embarked"] == "Q", "Embarked"] = 2
titanic_test["Fare"] =titanic_test["Fare"].fillna(titanic["Fare"].median())
13 Generating A Submission File
现在我们已经在训练集上建立了一个模型,并且可以在测试集上进行预测。最终我们将预测结果生成一个csv文件,使用submission.to_csv("Kaggle.csv", index=False)方法即可产生一个最终提交的csv文件。
14 Next Steps
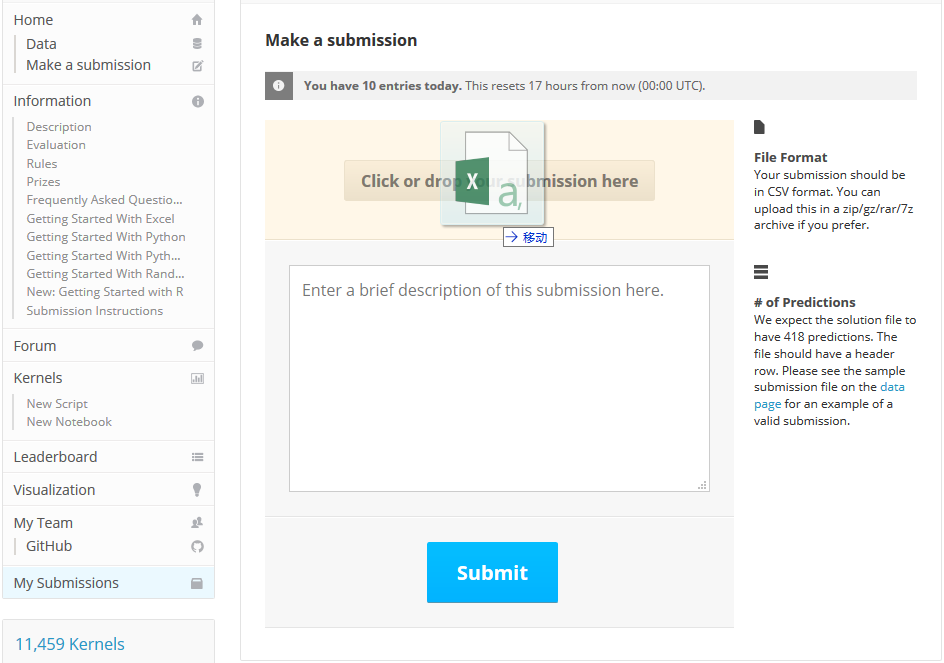
进入Make a submission页面,将我们生成的csv文件上传:
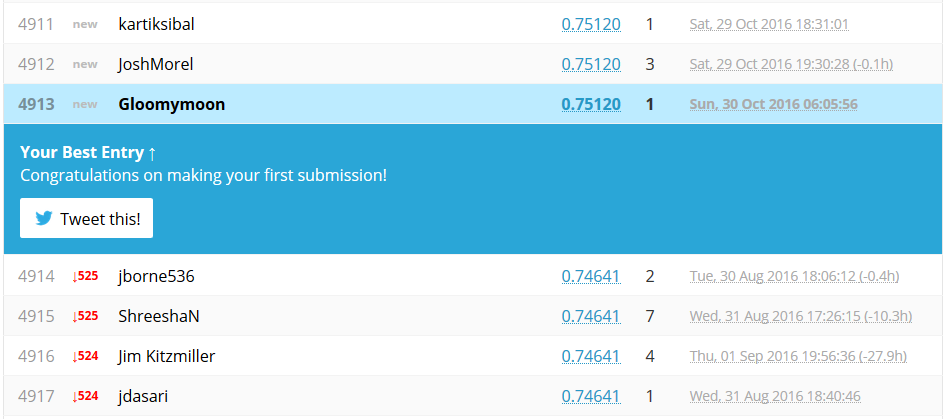
点击Submit按钮就能够看到成绩:
恭喜你已经成功提交了第一个Kaggle模型,后面我们会进一步学习如何来优化模型提升得分。